How Cage-Level Egg Production Monitoring Helps Identify Low-Producing Areas
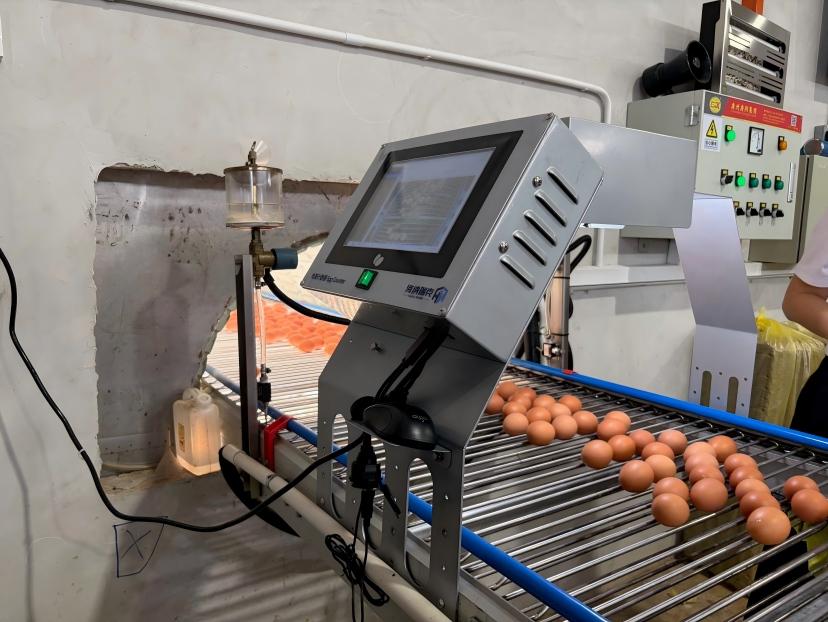
A layer house can reach its expected daily egg total while one cage group is already losing production. The rest of the flock may be performing well enough to conceal the decline. A house total tells the manager how many eggs were collected; it does not show which row, tier or section needs attention.
Conditions are rarely identical throughout a cage layer house. Uneven feed delivery, blocked drinking nipples, differences in lighting, local health problems and temperature variation can affect a relatively small area. By the time these losses become visible in the whole-house total, the farm may already have missed several opportunities to investigate.
Cage-level egg production monitoring adds location to the count. Its practical purpose is to narrow the area that staff need to inspect, so that a local problem can be investigated while the overall production figure still looks acceptable.
An egg count needs a reliable location
Machine vision and automatic egg counting provide the collection hardware. As eggs pass through a defined counting point, the system records their number. To build a production map, these records must also be associated with the correct house, row, tier, cage group or collection branch.
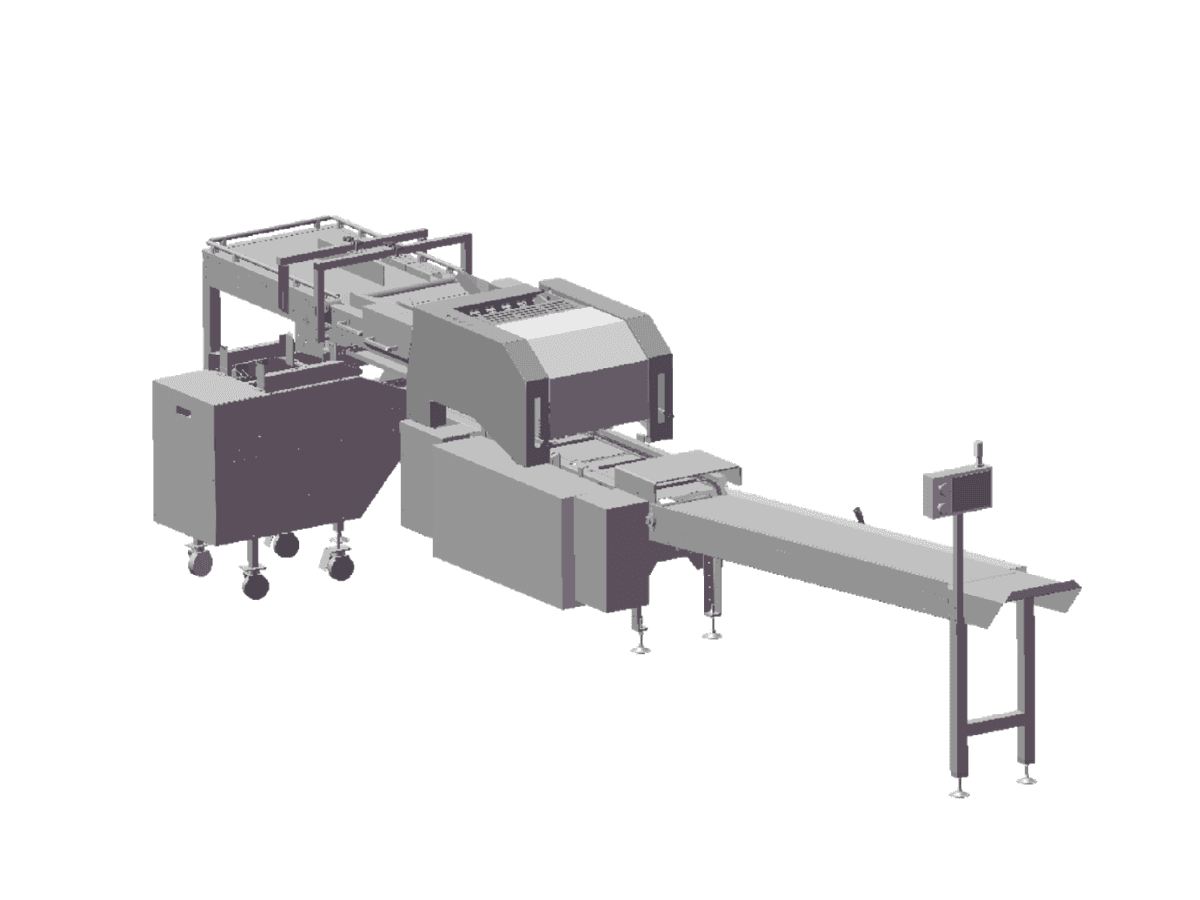
That association needs to be designed around the egg collection layout. A counter on a central conveyor, after eggs from several areas have mixed, cannot identify their original cage groups from the count alone. The project must use an appropriate collection arrangement, separate counting points or a validated collection sequence that retains the source information. The available reporting detail depends on this design.
Once the mapping is reliable, staff can compare areas within a house and follow the same area across days or flock cycles. Persistent underperformance and sudden changes become easier to locate. The useful output is a specific inspection lead, rather than another report showing only the farm total.
Match the equipment to the level of detail required
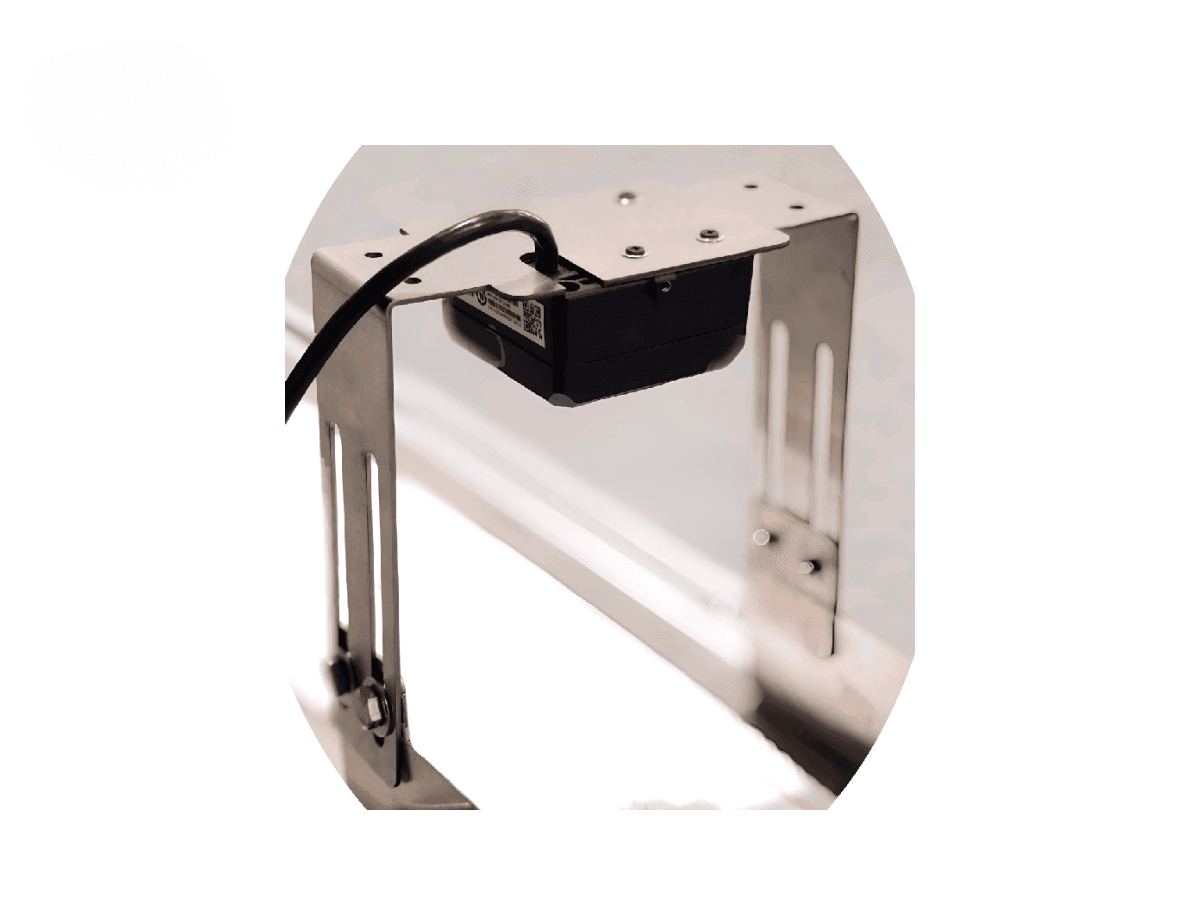
The Illinois eFarm cage-level egg production monitoring system is intended for automated egg belts in cage layer houses, with reporting that can extend from house totals to rows, tiers and cage groups according to the collection layout and confirmed configuration. HNRK-EC Series machine-vision egg counters collect the underlying egg-flow data; the monitoring platform organizes those records by location and time.
Before buying, ask the supplier to demonstrate how a recorded count corresponds to a physical cage group. Check what is retained after a power interruption, whether daily, weekly and monthly trends are available, and whether original records can be exported for review. These functions should be confirmed for the selected hardware and software, rather than inferred from a general description of a monitoring system.
Counting accuracy and location accuracy are different checks. A device may count the eggs passing its camera correctly while the platform assigns them to the wrong section. Commissioning should therefore verify both the count and its source label against the actual collection route.
A low production flag starts an inspection
Identifying a low-producing area does not establish the cause. The data shows where attention is needed; farm staff still have to inspect the birds and equipment.
If groups at the end of a row remain below their usual performance, uneven feed delivery is one possibility to check. Differences between upper and lower tiers may warrant closer inspection of temperature and lighting. A sudden fall requires checks of the egg belt, collection equipment and flock health before it is treated as a biological production loss. These are inspection priorities, not diagnoses made by the counter.
Inspect the recording process as well. An interrupted collection run, eggs remaining on a belt or an incorrect source assignment can change the reported output without representing a matching change in laying performance. Staff need to distinguish a collection or measurement problem from a genuine reduction in production.
Build a baseline before setting alarms
During the first period of operation, compare system records with manual spot checks and the actual egg intake at the packing area. Account for differences in collection timing and eggs still in transit. This helps establish whether the records are consistent and what normal variation looks like.
Raw counts also need context. Two cage groups with different numbers of live hens should not be expected to produce the same number of eggs. Where reliable bird numbers are available, compare eggs per live hen over the same collection period alongside the total count. Flock age and production stage also need to be considered.
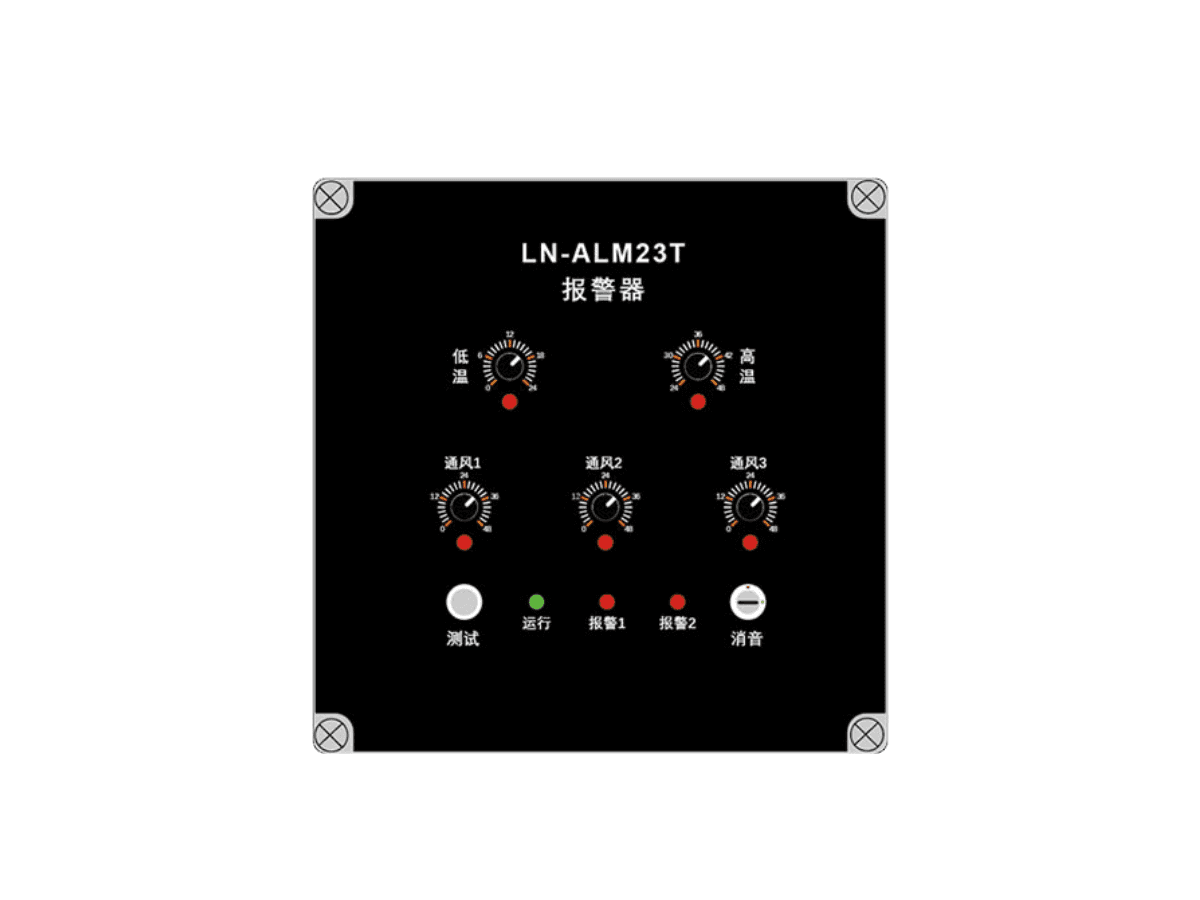
A single fixed alarm limit is unlikely to suit every flock. Feed changes, vaccination and heat stress can produce short-term variation. A more useful warning combines the area’s own recent baseline, comparisons with suitable neighboring groups and a trend that persists across several days. The threshold and follow-up rules should be agreed with the farm team.
Make each warning someone’s responsibility
An alert is only useful if someone follows it up. The platform should allow the farm to record who inspected the area, what was found and what action was taken. The next production records can then be reviewed alongside that action, rather than leaving the warning as an untracked notification.
Access should reflect the way the farm operates. A house manager may need the complete production picture, while a stockperson needs the sections assigned to them. A group operator may need comparisons across farms, and a distributor’s access should be limited to the agreed support role. These permission levels are requirements to confirm during platform selection.
Also check the behavior during a network interruption. Local buffering and subsequent upload, where provided by the selected configuration, should retain timestamps and source labels. Network-loss recovery and power-loss retention are separate functions and should be tested separately.
Read production alongside the conditions around the birds
Egg output shows the result of several interacting conditions. Reviewing it on the same timeline as temperature, feed use, water use and mortality or culling records gives staff more context for the inspection.
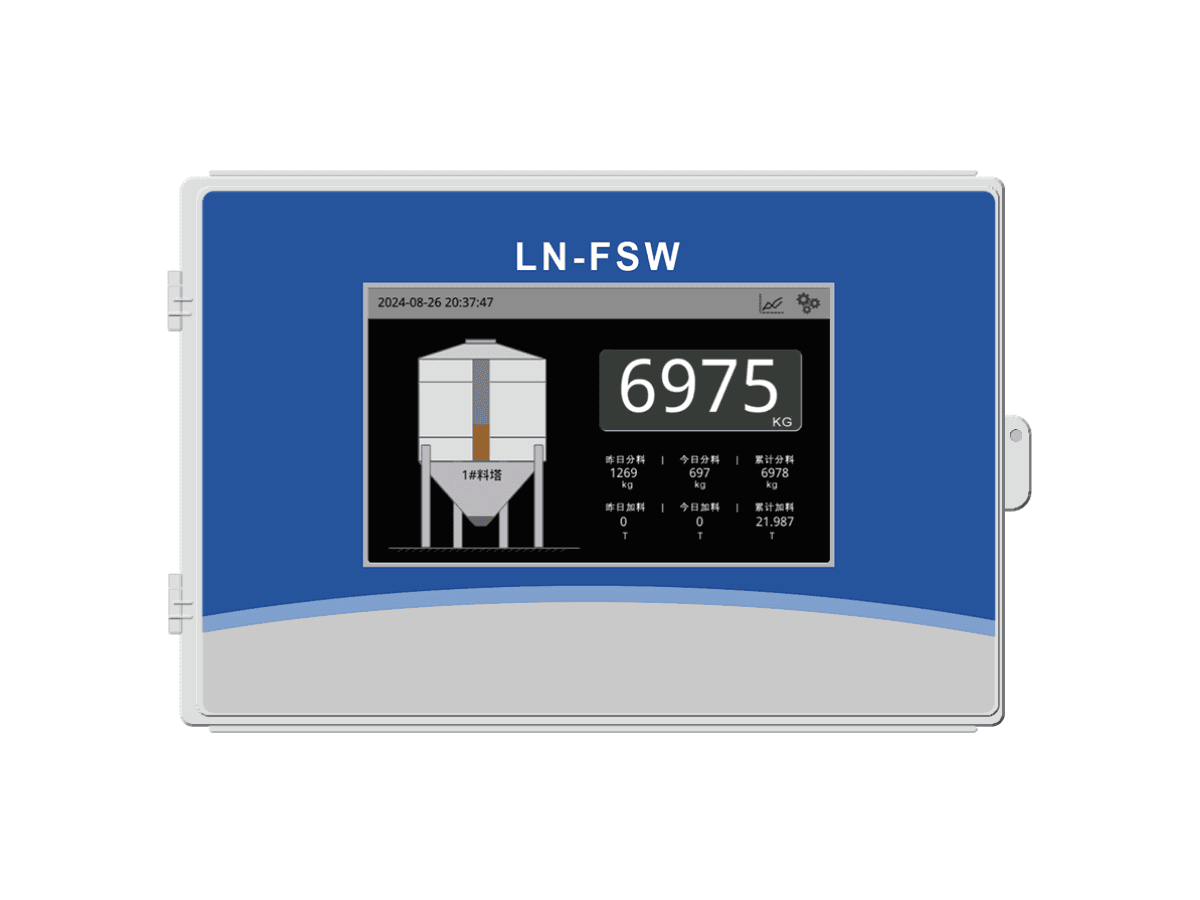
For example, a decline accompanied by high temperature and reduced feed intake calls for a different investigation from a decline recorded under stable environmental conditions but repeated egg-belt interruptions. Multi-point poultry-house environmental monitoring can help examine local differences, while continuous feed silo weighing supplies a broader inventory and feed-use record. A silo total does not identify the feed received by a particular cage group; the location and time scale of each measurement still matter.
Digital monitoring does not replace daily farm management. It makes the production map more specific, connects a warning to an inspection and helps the team review what happened afterward. The gain is seeing the local changes hidden inside a satisfactory total, early enough to take an informed next step.